 Floods happen when water rises and spreads over land that is usually dry, exceeding
the capacity of natural waterways and drainage systems.
Floods happen when water rises and spreads over land that is usually dry, exceeding
the capacity of natural waterways and drainage systems.
Flooding is a part of life in the Northern Rivers and is caused by flash flooding (overwhelmed drainage systems) and riverine flooding (rivers or creeks overflowing).
Every flood is different. How large and severe a flood is depends on how much rain falls, how quickly it falls, how wet the ground already is, and the features of the catchment and floodplain.
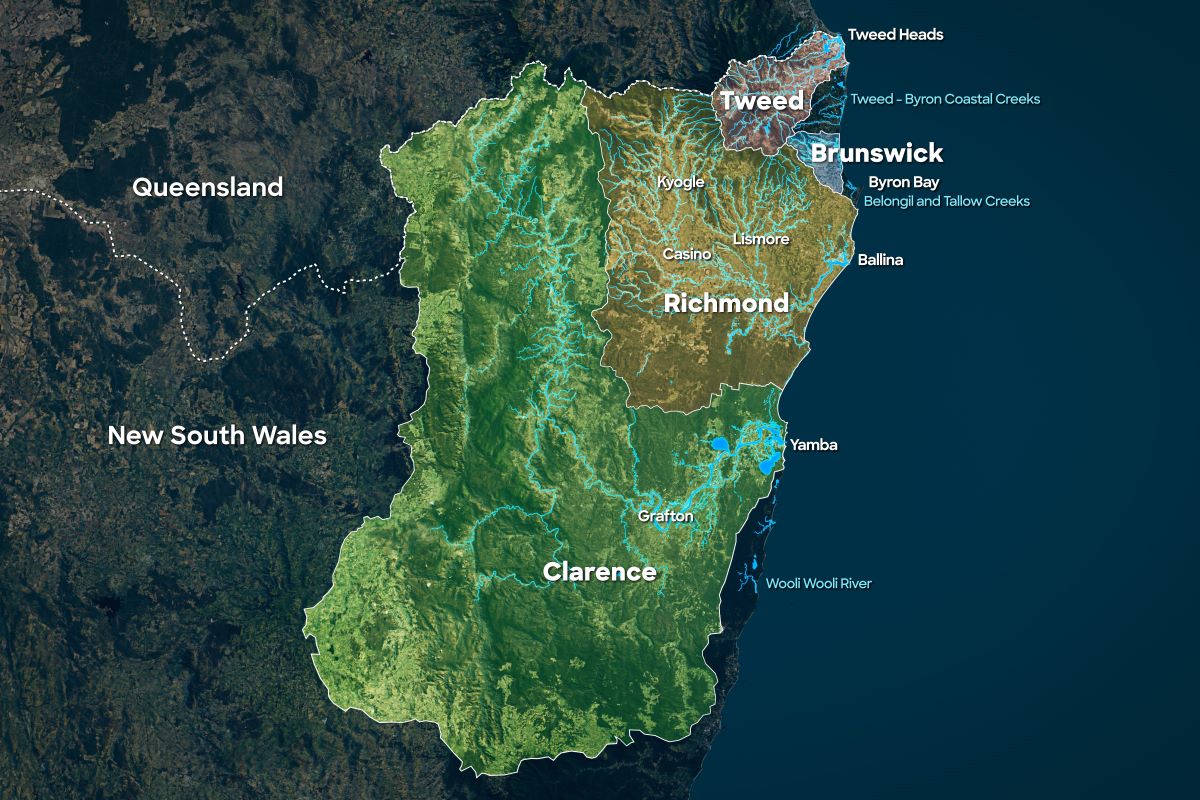
The four Northern Rivers catchments
The four main catchments in the Northern Rivers are the Tweed, Brunswick, Richmond and Clarence. Each catchment is unique, but they are influenced by shared weather patterns and can be flooded at the same time.
Learn more about flooding across our catchments here: www.ses.nsw.gov.au/northernrivers
Recent event: February 2022 Floods
- Between 22 February and 9 March 2022 extreme rainfall caused catastrophic flooding across Northern NSW and South East Queensland.
- Lismore and surrounding areas were inundated with water, and many other Northern Rivers towns experienced flooding. A second major flood four weeks later caused further devastation in already impacted areas.
- On 28 February 2022 the levee in Lismore overtopped, and the Wilsons River peaked at 14.4 metres. This exceeded the previous record by over 2 metres.
- Flooding caused extensive impacts across the region, including 6 deaths and an estimated 14,000 people displaced.
- 21,170 homes were damaged or uninhabitable, as well as significant damage to roads, buildings and essential services.
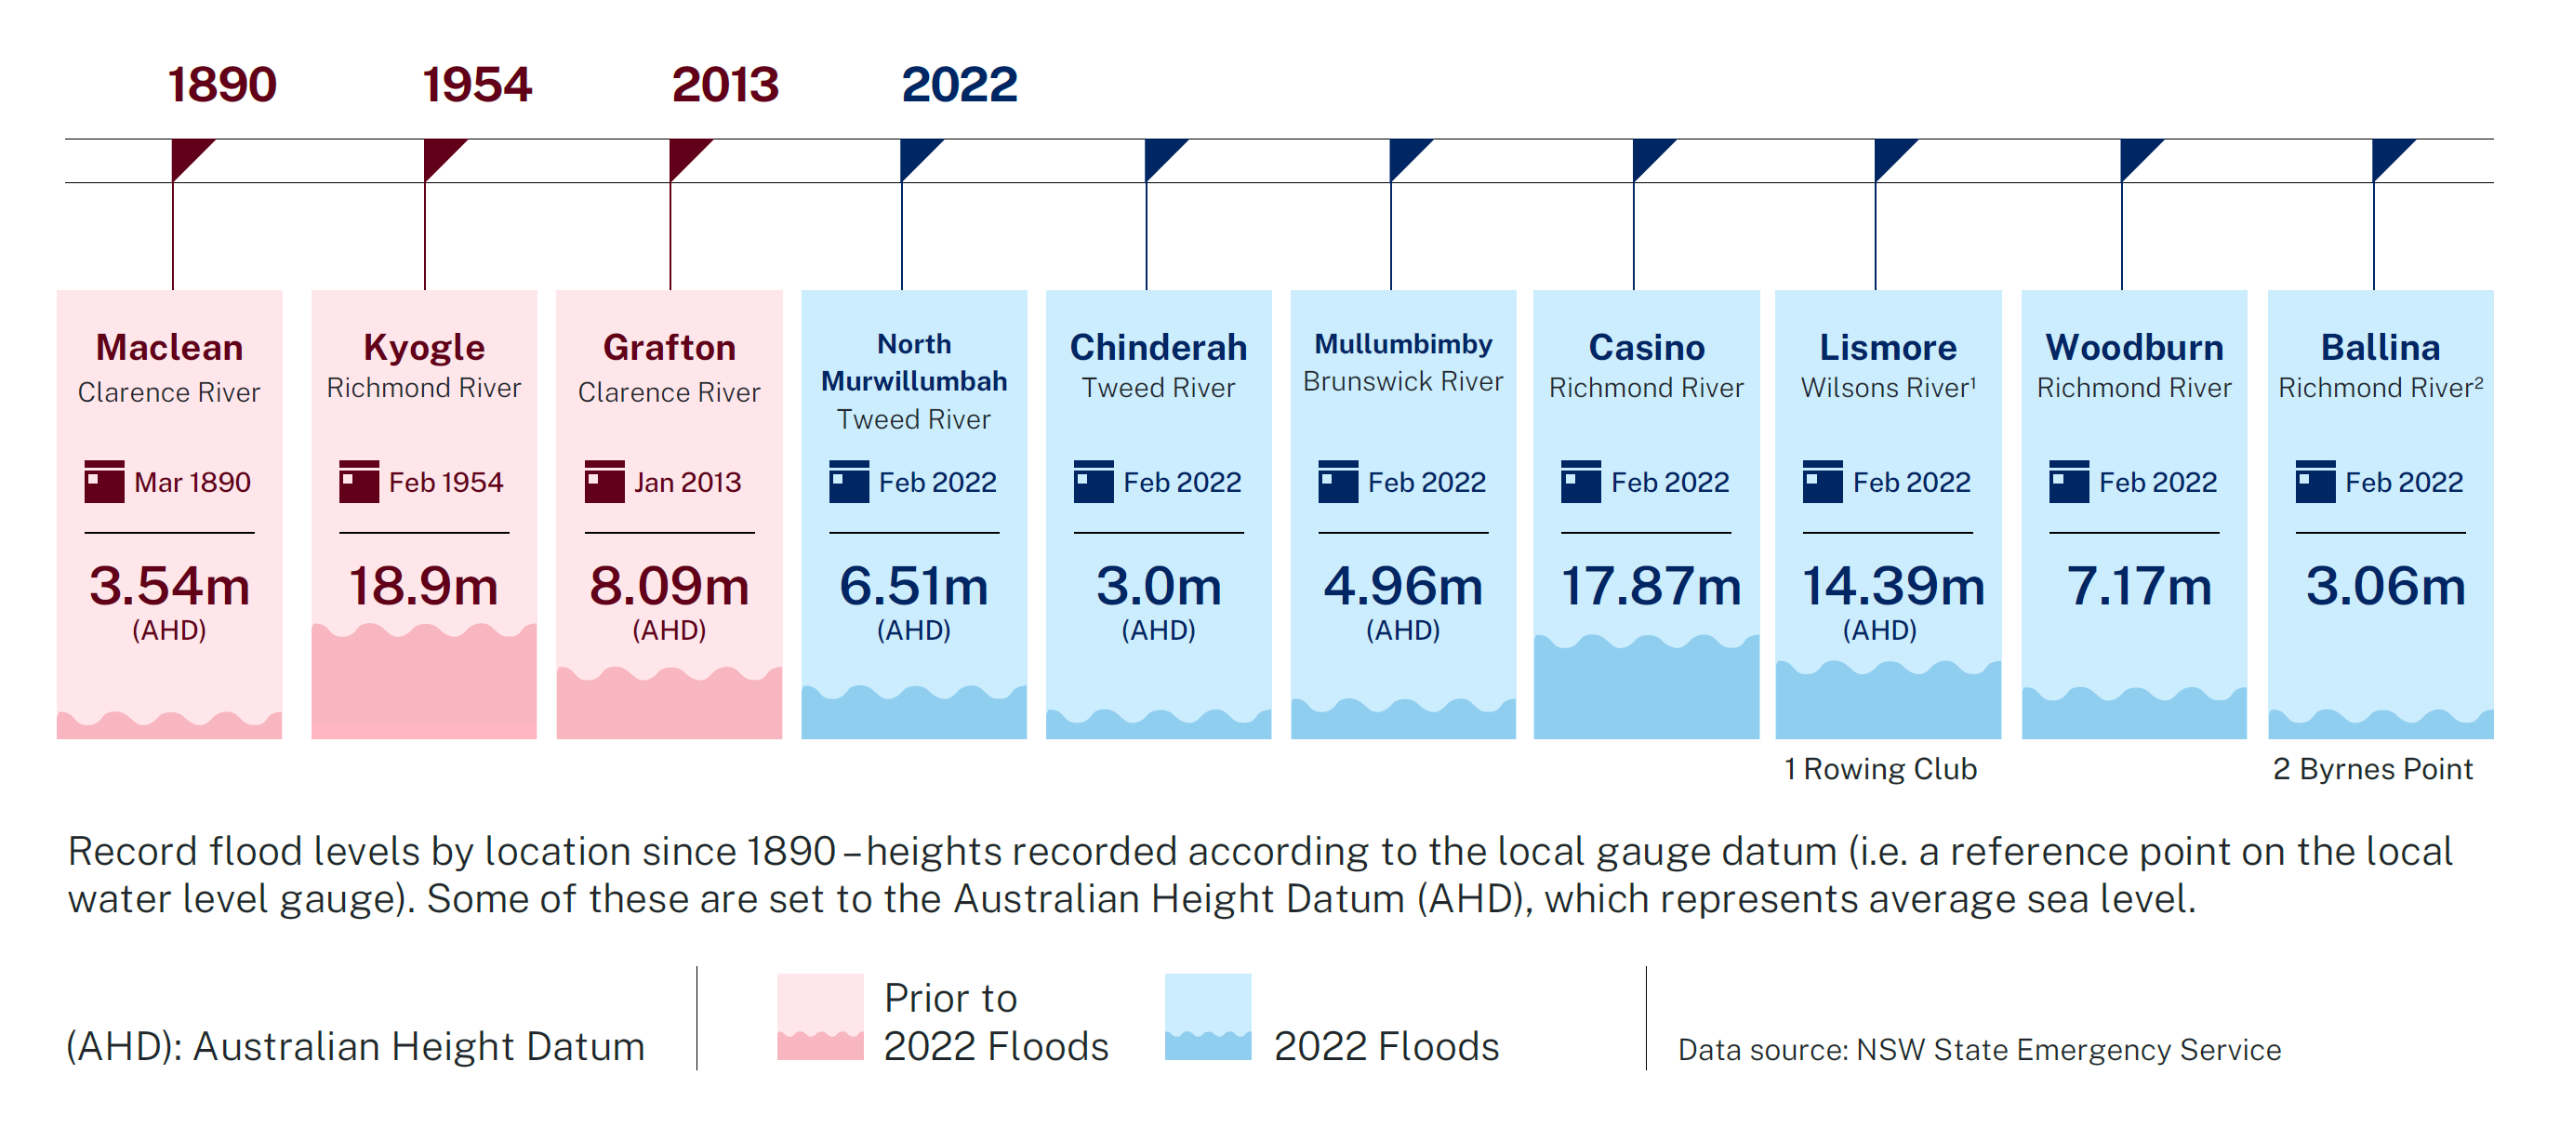
Record flood levels by location
Many floods have occurred across the Northern Rivers over time. In some locations the highest flood levels on record occurred in the 2022 floods, while in other places earlier floods were the highest on record.
Flood extents across the region
Floods are often described in terms of the chance that floods of a certain size might occur, such as 1 in 100 chance per year flood. The map depicts where flood water can reach under two flood scenarios.
1 in 100 chance per year flood extent
A flood that has a 1% chance of happening in any given year, known technically as AEP (annual exceedance probability).
Extreme or Probable Maximum Flood (PMF)
The largest flood that could conceivably be expected to occur at a particular location, usually estimated from probable maximum rainfall. It defines the maximum extent of flood prone land, also known as the floodplain.
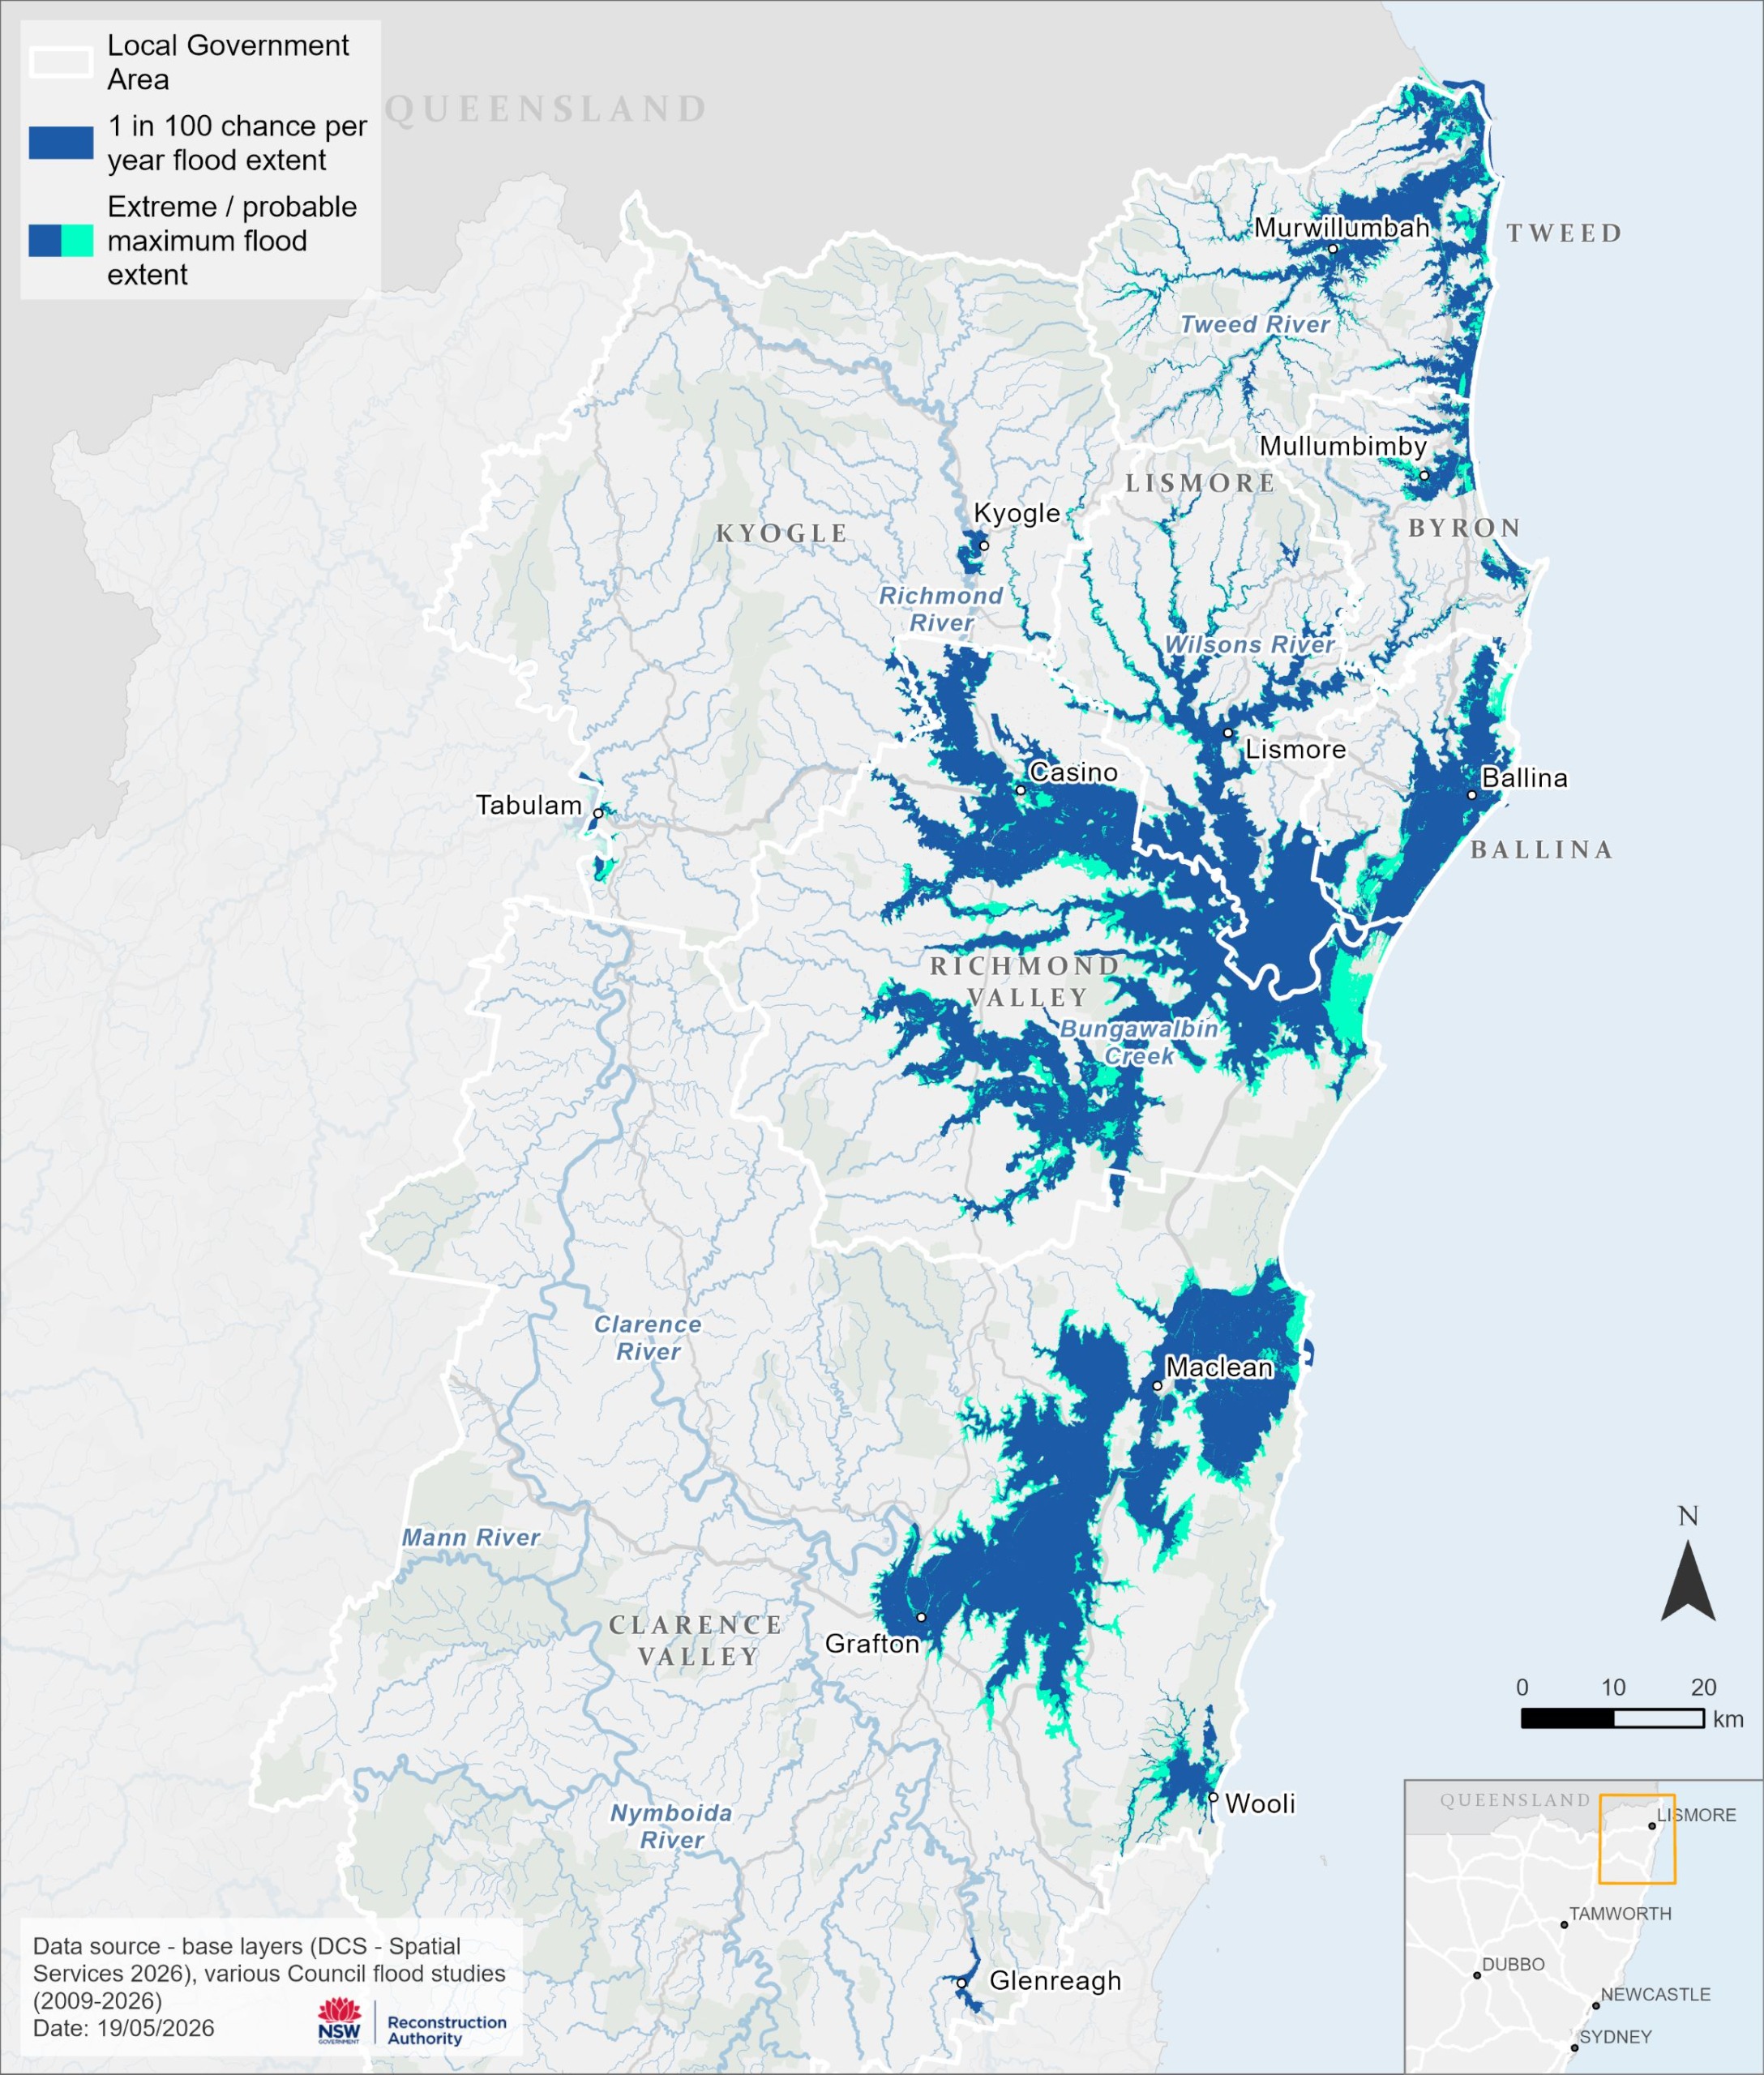
Note: The flood information on this map is based on published council flood studies, and may not represent the full extent of flooding possible in the region. If a flood exceeds the extent indicated on this map, NSW Government is not liable for any loss suffered as a result of reliance on this map.
Current and future risk
Current flood risk to buildings in the region
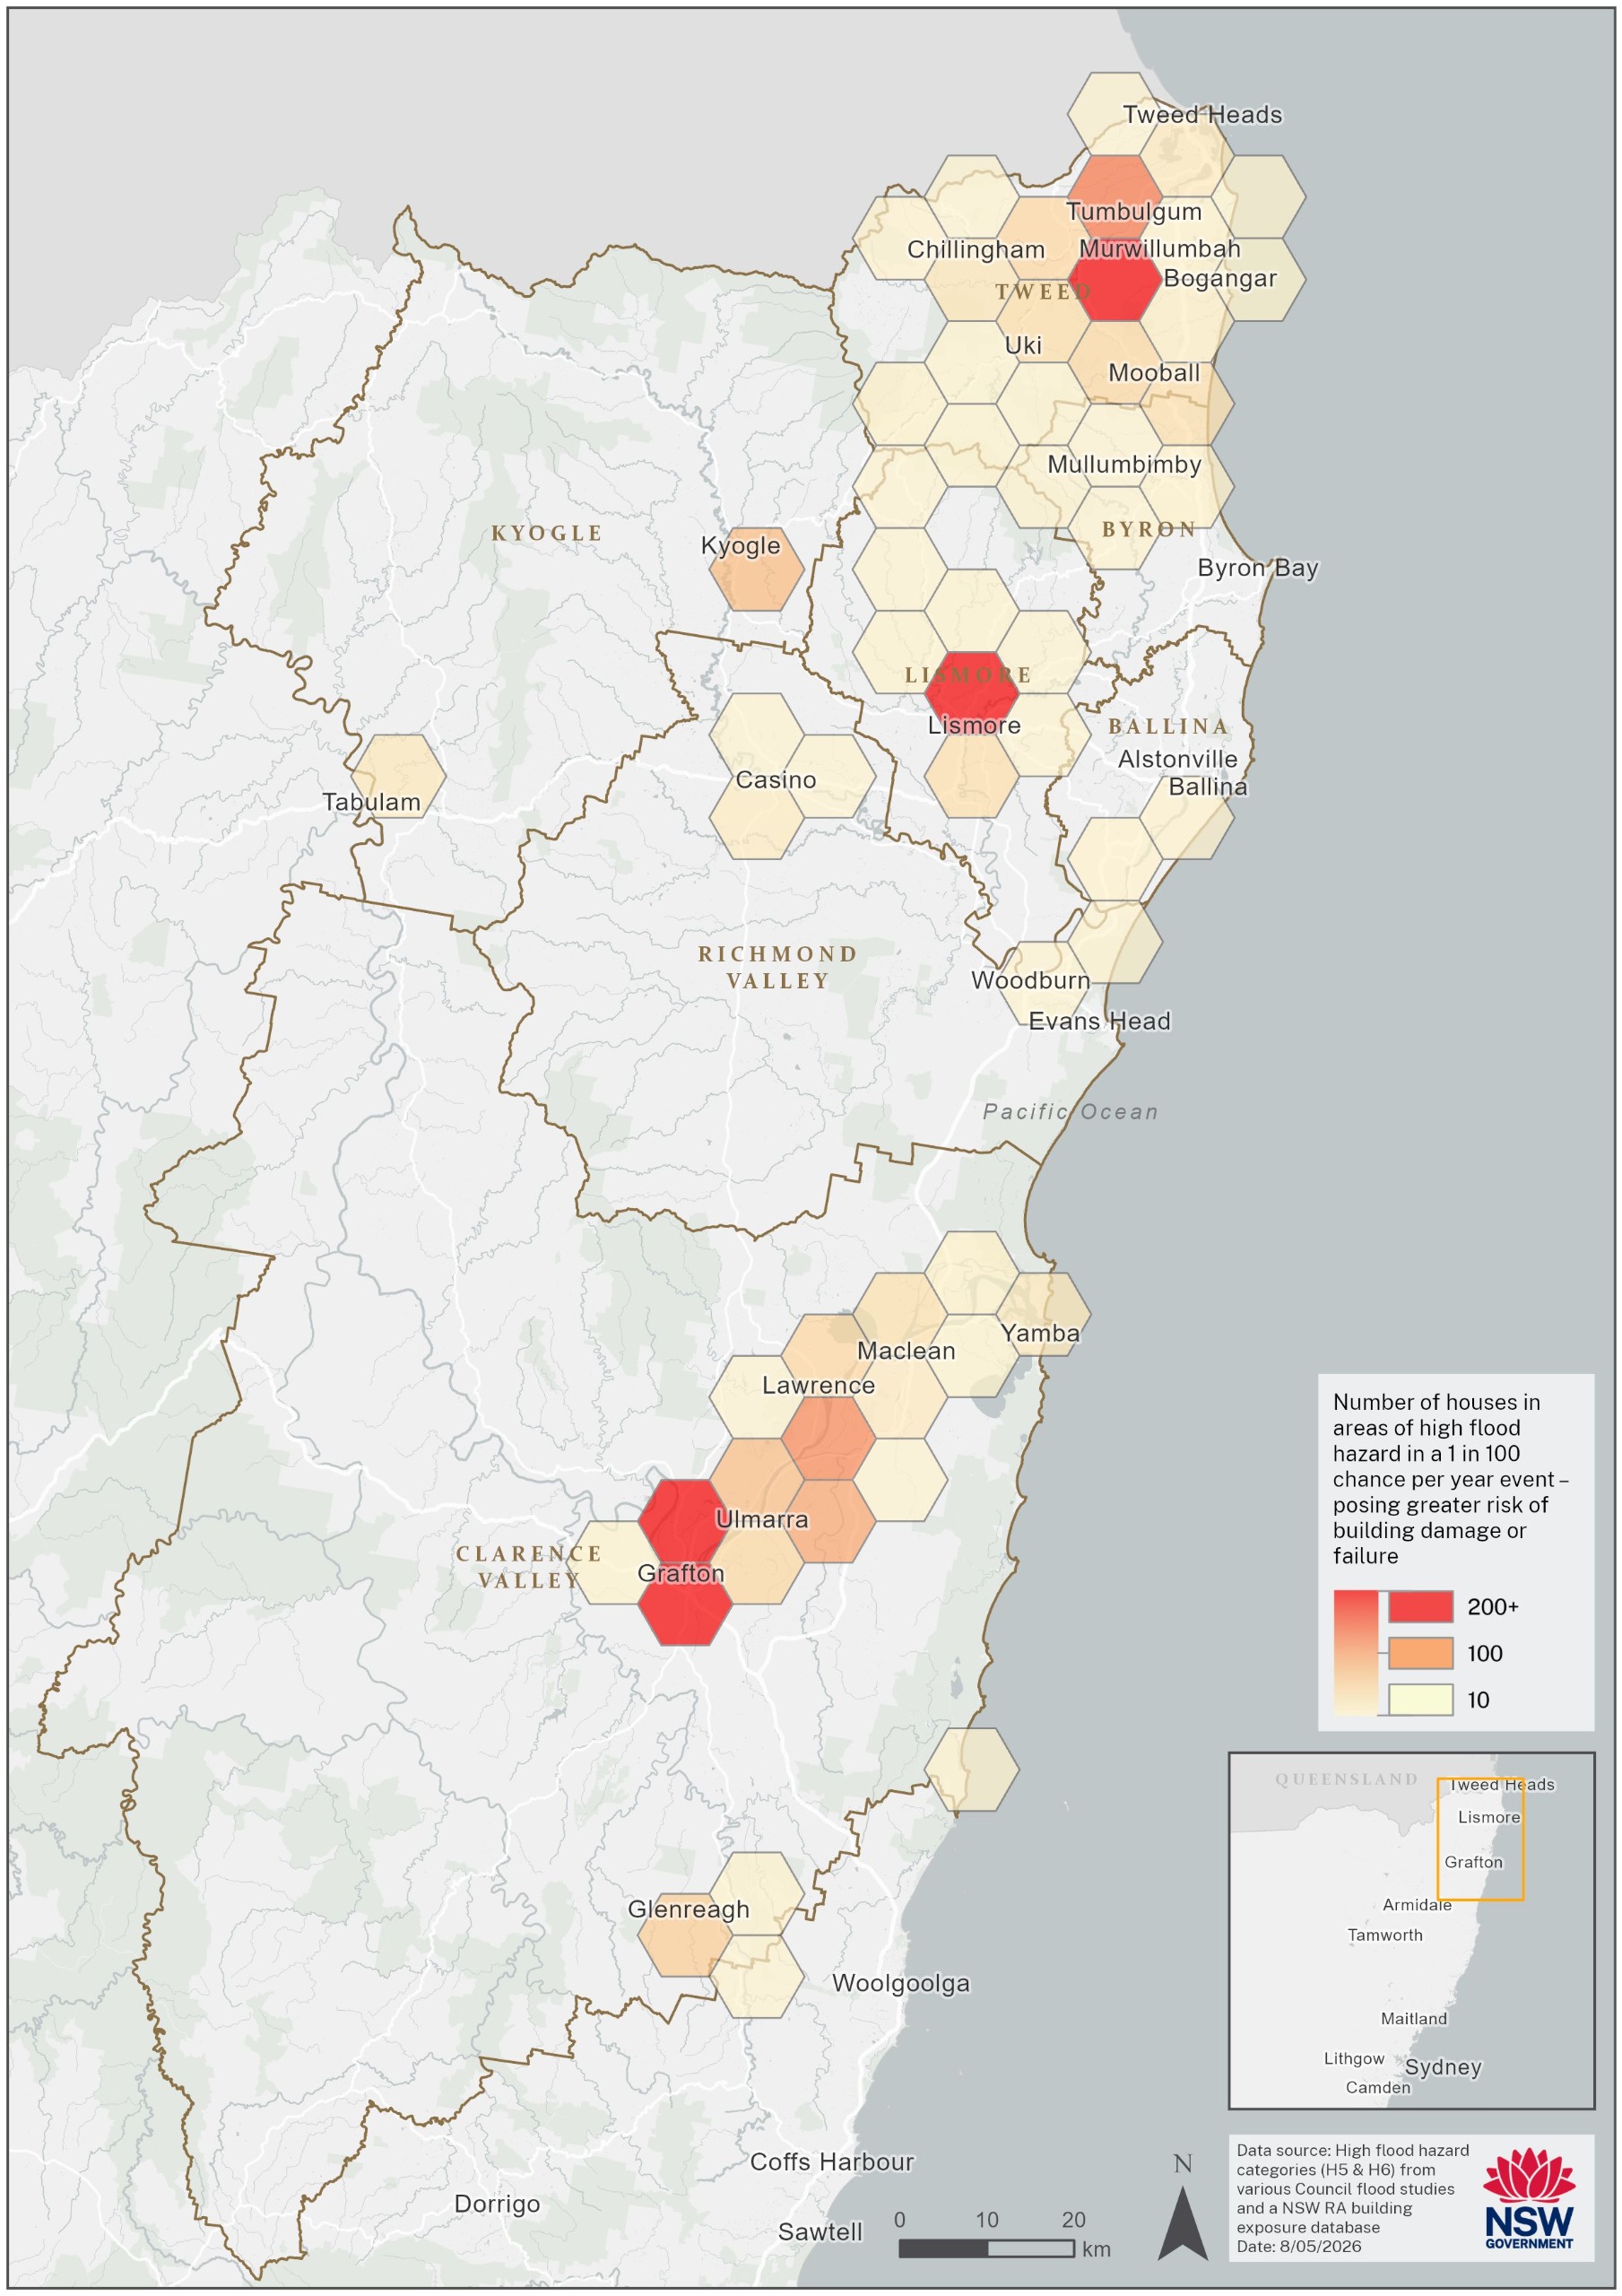
- Over 40% of residential, commercial and industrial buildings in the Northern Rivers are exposed to floods
- Flooding is a normal part of the water cycle, but it becomes dangerous when people, homes, infrastructure or essential services are affected. Many buildings in the region, including homes, are exposed to flooding, and could experience structural damage in deep and/or fast flowing floods
Future risk and the impacts of climate change on flood frequency
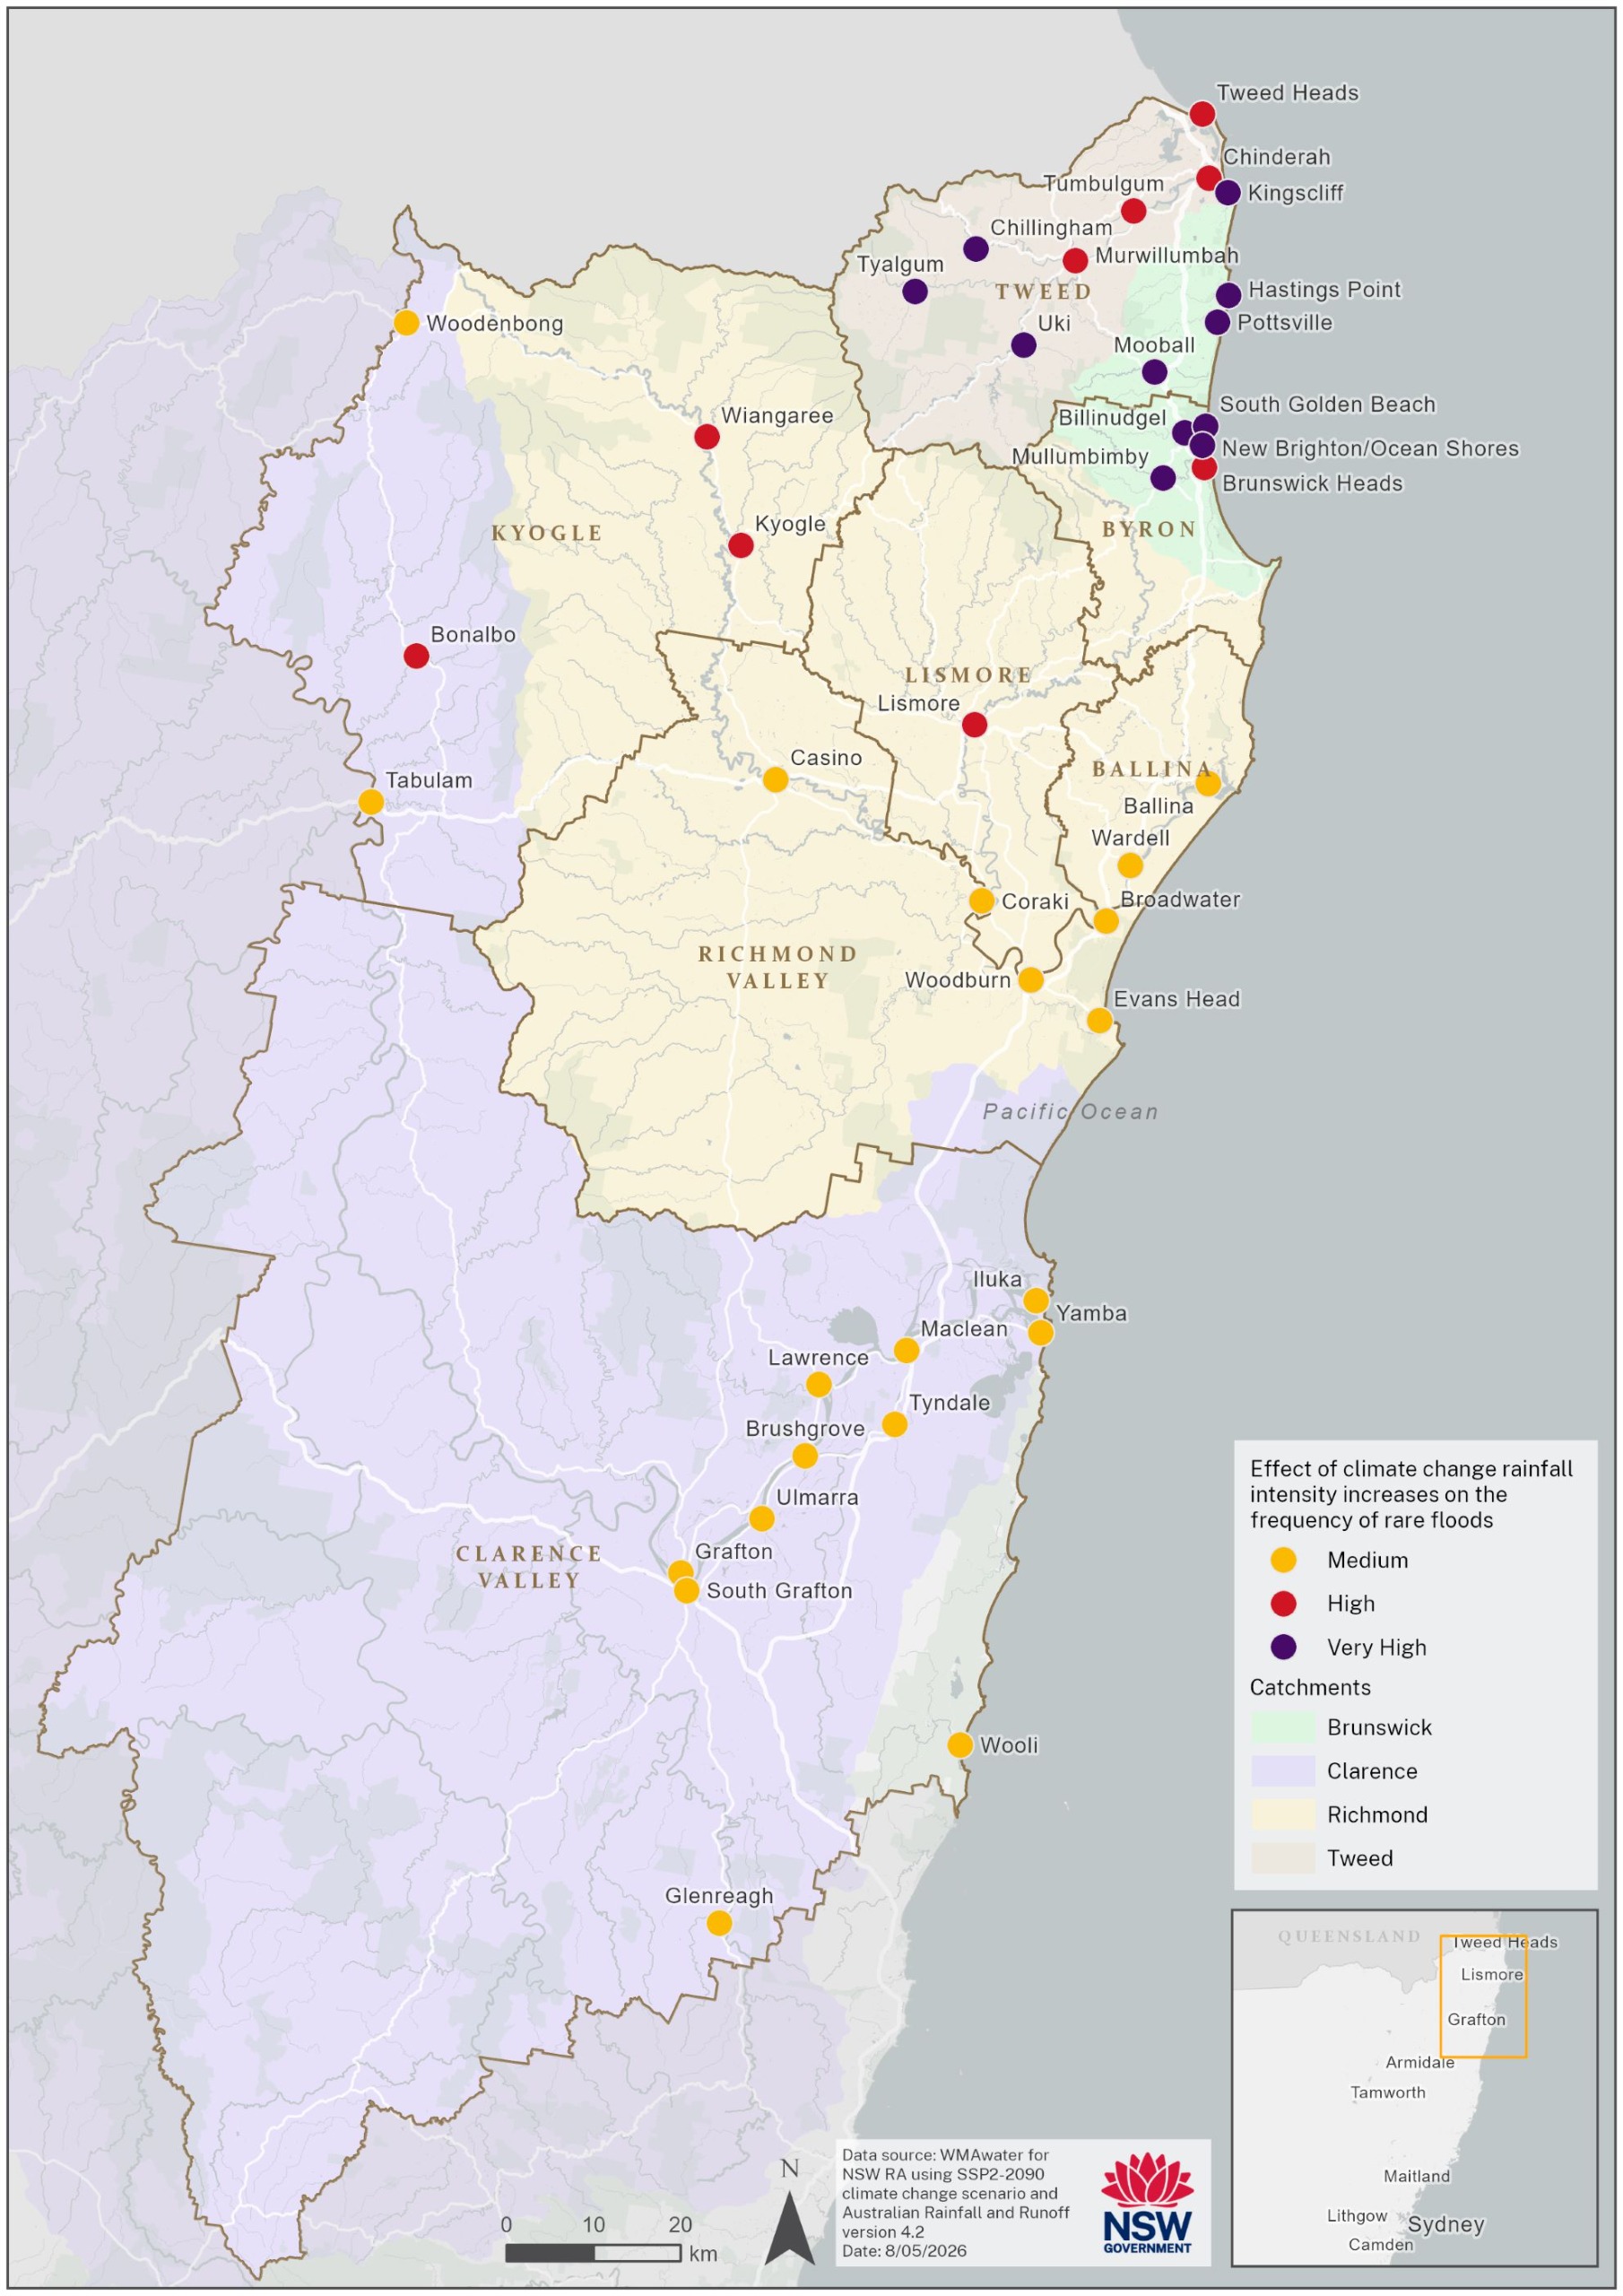
- Using a medium emissions scenario, climate modelling projects that smaller catchments in the Northern Rivers will likely experience more floods due to a greater increase in rainfall intensity compared to larger catchments. The map shows that communities in the Tweed Shire and Byron Shire will have the highest increased risk.
- Smaller catchments and estuarine locations will experience the greatest impact due to rainfall intensity and sea level rise. The level of risk will also increase as more people move into areas with flood risk.
Impacts
|
|
Built
|
|
|
Social
|
|
|
Economic
|
|
|
Natural
|
Next steps
Note: The information contained on these Have Your Say website pages is general information only, based on knowledge and understanding at the time of publication (June 2026) or otherwise based on data which pre-dates its publication, and may be subject to change at any time without notice. The State of NSW and its agencies (including the NSW Reconstruction Authority) do not give any warranty or representation as to the accuracy, reliability or completeness of the information. Read our full legal notice at bottom of the Have Your Say landing page.


